Conclusion: Key to understanding FPE is temperature
 The Progress Reports have revealed some important behaviors having a relationship to attempts at replication and to the various proposed theories. Its time to put these behaviors in context and suggest some conclusions.
If you are tempted to speculate on your own, please do read the reports first and make yourself knowledgeable about what has been observed in other studies published over the last 26 years. We now have enough information, when considered in its totality, to arrive at some very firm conclusions.
Progress will be made only when this understanding is accepted and used as a guide to support additional understanding.
As anyone who is familiar with the many observations will understand; the conclusions noted below are totally consistent with past observed behavior. The only conflict is with the past conclusions. Many of these past conclusions are now shown to be wrong.
1. The LENR process is not initiated when a sample of Pd is initially loaded to high composition. Additional treatment is required to cause the LENR process to start. Once this additional treatment is successful, LENR will take place over a very wide range of deuterium concentration, even after all D is removed and the sample is again reacted with D.
2. Only certain batches of Pd can be activated. One of the requirements for successful activation is lack of significant excess volume formation when the Pd is reacted with D.
3. Excess power produced by an activated sample is very reproducible once it is initiated as long as the surface is not removed. This behavior is consistent with the surface being the location of the nuclear reaction based on the behavior of helium release.
4. Once the LENR process starts, the amount of current applied as electrolytic current has no effect on the amount of excess power produced. Only the temperature of the active surface has any effect on excess power production, with higher temperatures producing greater excess power. We can assume that once a sample is activated, simply exposing it to D2 gas and heating it would cause excess power production. In other words once the sample of Pd is activated, use of electrolysis is no longer necessary.
5. The activation energy for excess power production based on the temperature effect is similar to the value for the activation energy for diffusion of D in PdD. We can assume excess power production is controlled by how fast the D can diffuse from the surrounding lattice to the NAE where the nuclear reaction occurs.
6. So called life-after-death will result in eventual destruction of the sample if the temperature is not controlled, as some people have observed. In other words, the system suffers from positive feedback as Rossi has also experienced using the Ni-H2 system. This positive feed back is generally not observed because the amount of power produced relative to the rate at which it can be lost is small.
7. Once the role of electrolytic current is understood, the F-P method can be seen to have the same basic behavior as all methods found to initiate LENR, including the Ni-H2 system. In other words, no reasons exists based on observed behavior to consider the Pd-D2 system different from the Ni-H2 system. Only the reacting isotopes are different which naturally would produce different nuclear products.
All of behaviors and conclusions resulting from this study are consistent with the Nano-crack theory I proposed. Most other proposed theories are not consistent with all the observations and conclusions. These conflicts need to be resolved for any progress to be made.
See also:
09.29.15Progress Report #6
This report extends the insights described in Report #5 and shows that several common conclusions about LENR are wrong. These errors have handicapped efforts to achieve reproducibility and have lead several theories in the wrong direction.
PROGRESS-REPORT-6 Additional behavior of pure PdD (1.3Mb)
Temperature plays a significant role in affecting the amount of power produced by LENR. The activation energy for power production is very similar to the activation energy for diffusion of D in PdD. This behavior is consistent with my theory in which temperature is described as helping D reach the NAE by diffusion through the surrounding lattice.
Comments are welcome.
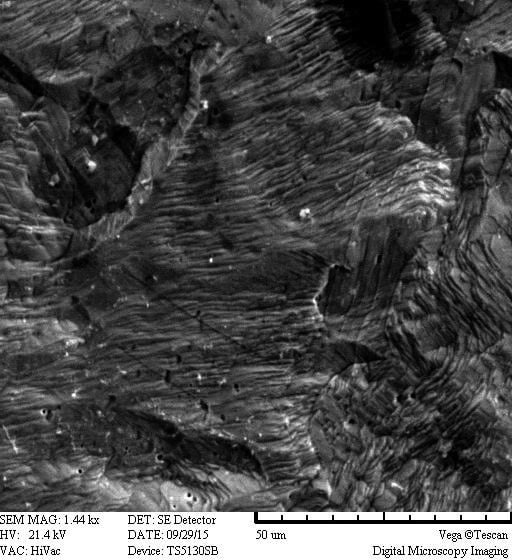
Figure 9 from Progress Report #6 showing surface of the Pd cathode after the study.
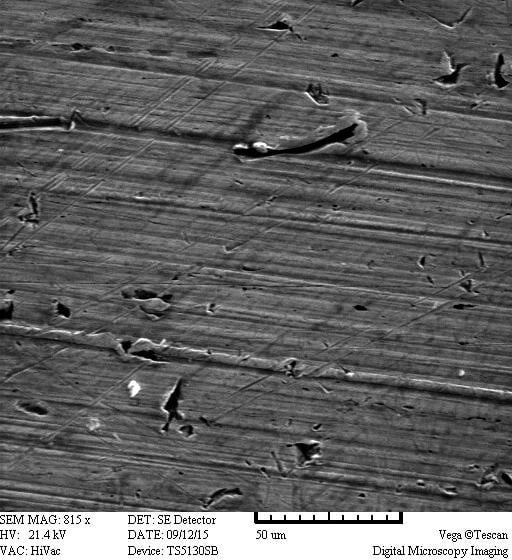
Figure 10 from Progress Report #6 shows surface of Pd before the study.
Read more from PROGRESS-REPORT-6 (1.3Mb)
See also:
09.14.15Progress Report #5
Here is the latest progress report. Shown are some important behaviors that have been misinterpreted in the past, so a careful reading would be useful. This report will appear with the other Reports on www.LENRexplained.com. Because these are quickly written informal reports, some typos and other errors are to be expected. Comments and suggestions are welcome.
PROGRESS-REPORT-5 (20Mb) (corrected)
This study is an example of having available an apparatus that can detect new behaviors only because such behaviors are expected. We see only what we are permitted to see by the apparatus. Consequently, the design of the apparatus is basic to understanding LENR. In this case, the design was influenced by the behaviors predicted by my theory.
Fig. 9 from Report #5. Overall view of the calorimeter showing the position of a laser. A laser is positioned to apply laser light to the cathode surface at various angles and locations. The laser can be focused to change the spot size on the target, heated to change its frequency, and rotated to change its polarization relative to the target. A second laser can also be used either together or independently. A hole through the back of the calorimeter allows insertion of a fiber optical cable to measure the frequency of the laser. The laser is not being used at the present time.
Production of excess energy is once again claimed, but this time it is correlated with radiation being generated by the energy-producing process. This correlation is new and provides powerful evidence for the excess energy being real and being caused by a nuclear reaction.
As for the importance of radiation. I have gradually come to the conclusion that claims for excess energy can not be attributed to a nuclear process unless they are correlated with the products of a nuclear process. The correlation with helium production meets this requirement. However, these measurements are difficult and expensive. Detection of radiation also meets this reqirement. In this case, the measurement is easy and cheap. The only requirement is to actually use a sensitive detector within the apparatus. Radiation with the energy being detected can not be made by a chemical reaction. This is proof of a nuclear process. As for reproducibility, I have already reproduced the effect several times and intend to use the correlation to justify my claims for producing LENR.
The role of temperature was largely misinterpreted in the past. Production of power is controlled by the ambient temperature, not by using pulses, although pulses will have an effect because they change the average ambient temperature. This realization has profound importance to any proposed explanation.
The composition of the PdD is not the most important variable in determining whether excess power will be produced. This study shows that temperature is one of the most important variables, which according to my theory affects the rate at which the D can diffuse to the NAE where the nuclear reaction takes place.
Of course, the NAE must be first created before any excess power will be produced regardless of the temperature. Temperature alone does not create the NAE nor does the composition alone create the NAE.
The ultimate challenge is to discover exactly what does cause the NAE to form. That is the goal of this study.
PROGRESS-REPORT-5 (20Mb) (corrected)
See also:
08.31.15Progress Report #4
PROGRESS-REPORT-4 Effect of Important Variables
INTRODUCTION
The previous Progress Reports can be read at www.LENRexplained.com. The various novel features of the calorimeter are explored in this Progress Report.
These features included measurement of OCV, loading behavior, the effect of temperature on the various behaviors, and the behavior of volume expansion resulting from repeated loading and deloading.
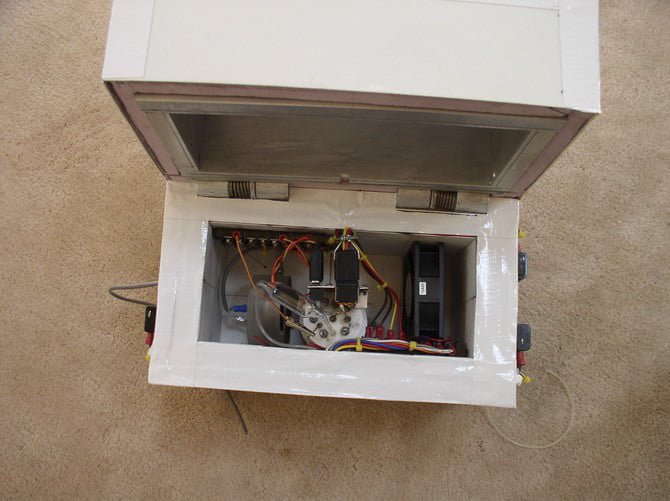
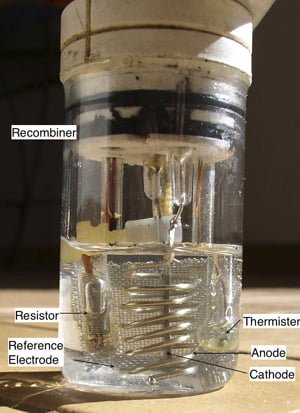
From Progress Report #1, a view inside the calorimeter showing the components. The cell is in the
center, the GM detector is on the left, and the fan is on the right.
A number of Pd-Ag compositions have been made and subjected to treatments and measurements considered important to this study. These treatments include measurement of the sample volume during various stages in its treatment and subjecting the sample to various methods to improve its reaction with hydrogen.
The relationship between each of these variables and production of excess energy will be established in order to improve the reproducibility of producing this extra energy. The initial results from the study of each of these variables are described and discussed below.
RESULTS
1. Expansion behavior
As described previously(1, 2), the guide used to design this research identifies expansion of the material as result of reaction with hydrogen as being an important variable for excess power production. Because the excess power requires deuterium to be present, the sample must first react with deuterium. This reaction causes the material to expand and change shape by more than would be expected based on the known increase in lattice parameter of the beta phase. This additional volume is retained when the hydrogen isotope is removed. This shape change is proposed to produce uneven stress and formation of cracks, which allow a nuclear process to take place in the gaps when the gap is exactly right. Consequently, the amount of hydrogen able to react and the resulting uneven expansion is important to know and control.
The expansion is measured using micrometers after various treatments have been applied. An example of this behavior using pure palladium is summarized in Table 1. ….
Continue to read PROGRESS-REPORT-4
1. E. K. Storms, The explanation of low energy nuclear reaction. (Infinite Energy Press, Concord, NH, 2014), pp. 365 pages, (updated e-version available at Amazon.com).
2. E. K. Storms, A Theory of LENR Based on Crack Formation. Infinite Energy 19, 24-27 (2013).
See also:
08.24.15Progress Report #3
This study involves creation of various alloys, their activation for reaction with deuterium in an electrolyte cell, and measurement of any energy resulting from LENR. The process involves variables important to success, which are described in this series of progress reports. Copies of Reports #1 and #2 can be accessed at www.LENRexplained.com, where subsequent reports will be found.
Progress report #1 describes the construction of the calorimeter being used in this study and the approach used to find nuclear active material. Progress report #2 describes the initial calibration and the expected errors. This report summarizes some problems and solutions discovered during the initial tests.
1. Calorimeter drift: The calibration of the calorimeter has been found to have changed, probably because the epoxy used to attach the TEC to the aluminum box has cured and now has a slightly different thermal conductivity. This change resulted in what appeared to be excess power being generated by the samples being studied. A routine test of the calorimeter using an inert platinum cathode revealed this change and the resulting error.
This test also revealed an error caused by the rapid variations in cell voltage caused by bubble formation that is not present when a resistor is used to apply energy to the calorimeter. This error was eliminated by inserting a 10,000 mfd capacitor in the voltage circuit to smooth the variations and by increasing the number of measurements that are averaged. These changes produce agreement between the power applied to the electrolytic cell and power applied to a resistor to within 0.02 watt over the range of applied power (0-34 watts) used in this study.
The resulting calibration values are plotted in Fig. 1, to which a quadratic equation is fit.

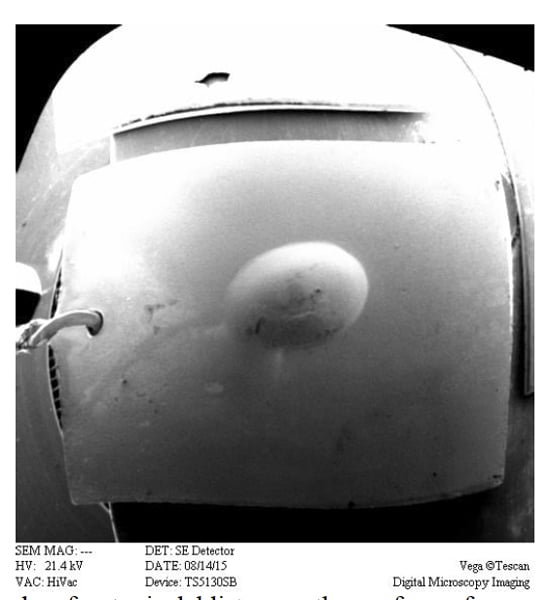
2. Preparation of samples: The samples are prepared by melting together Pd and Ag using a flame. The initial flame used LP gas and oxygen, which placed significant carbon in the material and caused many blisters to form on the surface after reaction with deuterium. These blisters interfere with making an accurate measurement of thickness.
Fig. 2 shows a large blister on a typical sample. Many of the blisters were too small to detect by eye. In addition, the flame was not hot enough to fully melt the entire sample, leaving an unmelted region where the sample contacted the graphite sheet on which it rested. Consequently, a uniform composition of silver was difficult to achieve.
Read more in PROGRESS REPORT #3
See also:


| Posted in Science | 10 Comments »