The Explanation of Low Energy Nuclear Reaction
An Examination of the Relationship Between Observation and ExplanationProgress Report #3
This study involves creation of various alloys, their activation for reaction with deuterium in an electrolyte cell, and measurement of any energy resulting from LENR. The process involves variables important to success, which are described in this series of progress reports. Copies of Reports #1 and #2 can be accessed at www.LENRexplained.com, where subsequent reports will be found.
Progress report #1 describes the construction of the calorimeter being used in this study and the approach used to find nuclear active material. Progress report #2 describes the initial calibration and the expected errors. This report summarizes some problems and solutions discovered during the initial tests.
1. Calorimeter drift: The calibration of the calorimeter has been found to have changed, probably because the epoxy used to attach the TEC to the aluminum box has cured and now has a slightly different thermal conductivity. This change resulted in what appeared to be excess power being generated by the samples being studied. A routine test of the calorimeter using an inert platinum cathode revealed this change and the resulting error.
This test also revealed an error caused by the rapid variations in cell voltage caused by bubble formation that is not present when a resistor is used to apply energy to the calorimeter. This error was eliminated by inserting a 10,000 mfd capacitor in the voltage circuit to smooth the variations and by increasing the number of measurements that are averaged. These changes produce agreement between the power applied to the electrolytic cell and power applied to a resistor to within 0.02 watt over the range of applied power (0-34 watts) used in this study.
The resulting calibration values are plotted in Fig. 1, to which a quadratic equation is fit.

2. Preparation of samples: The samples are prepared by melting together Pd and Ag using a flame. The initial flame used LP gas and oxygen, which placed significant carbon in the material and caused many blisters to form on the surface after reaction with deuterium. These blisters interfere with making an accurate measurement of thickness.
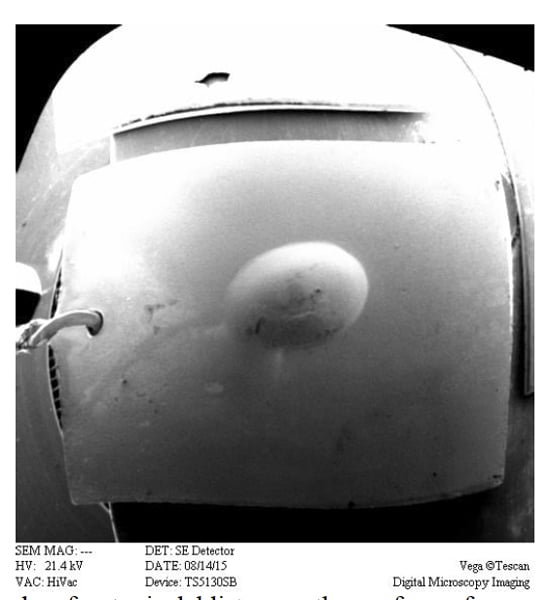
Fig. 2 shows a large blister on a typical sample. Many of the blisters were too small to detect by eye. In addition, the flame was not hot enough to fully melt the entire sample, leaving an unmelted region where the sample contacted the graphite sheet on which it rested. Consequently, a uniform composition of silver was difficult to achieve.
Read more in PROGRESS REPORT #3
See also:
| August 24th, 2015 | Posted in Science |