Progress Report #6
This report extends the insights described in Report #5 and shows that several common conclusions about LENR are wrong. These...
This report extends the insights described in Report #5 and shows that several common conclusions about LENR are wrong. These...
Here is the latest progress report. Shown are some important behaviors that have been misinterpreted in the past, so a...

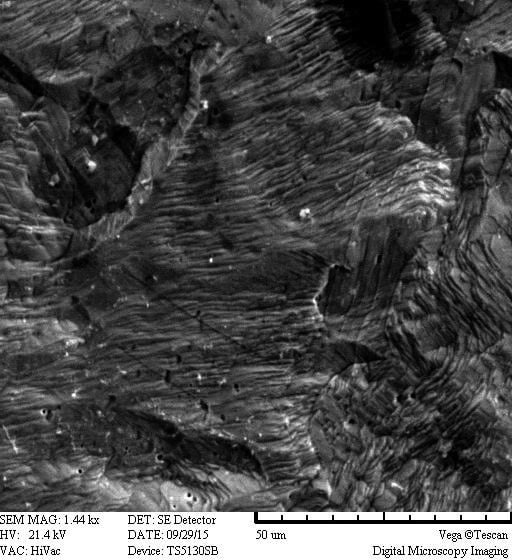
PROGRESS REPORT #3 This study involves creation of various alloys, their activation for reaction with deuterium in an electrolyte cell,...
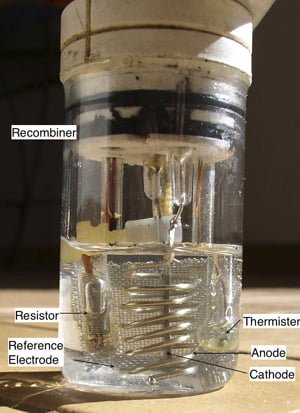
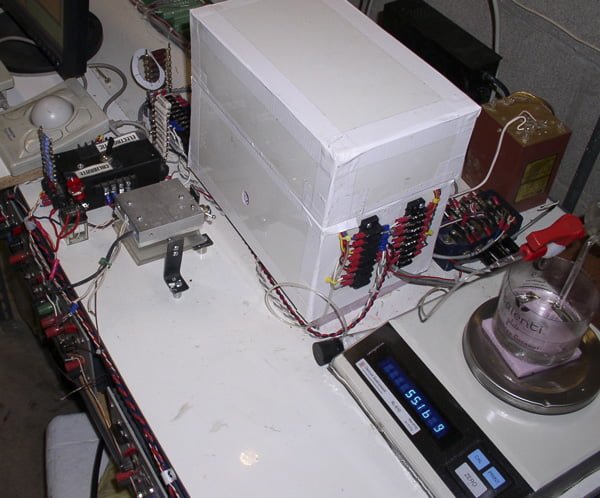
This report describes how a Seebeck calorimeter is calibrated in order to measure the amount of excess power produced by...
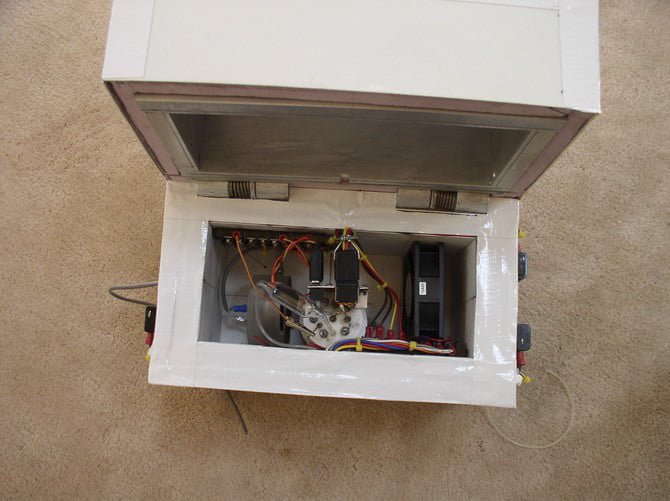
I'm starting a relatively rare kind of project for this field. I have designed and built a Seebeck type calorimeter...
