Progress Report #5
Here is the latest progress report. Shown are some important behaviors that have been misinterpreted in the past, so a careful reading would be useful. This report will appear with the other Reports on www.LENRexplained.com. Because these are quickly written informal reports, some typos and other errors are to be expected. Comments and suggestions are welcome.
PROGRESS-REPORT-5 (20Mb) (corrected)
This study is an example of having available an apparatus that can detect new behaviors only because such behaviors are expected. We see only what we are permitted to see by the apparatus. Consequently, the design of the apparatus is basic to understanding LENR. In this case, the design was influenced by the behaviors predicted by my theory.
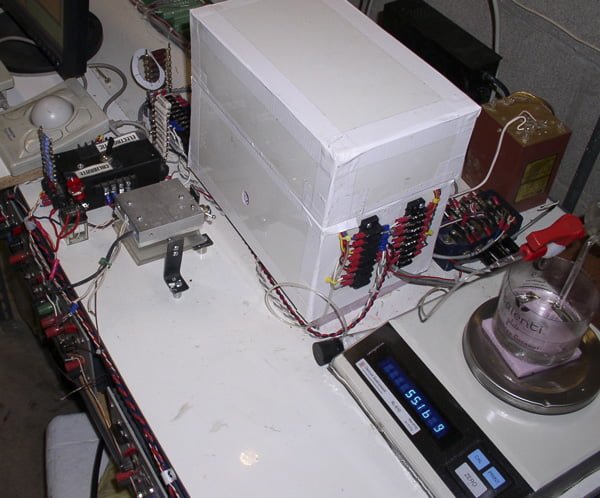
Fig. 9 from Report #5. Overall view of the calorimeter showing the position of a laser. A laser is positioned to apply laser light to the cathode surface at various angles and locations. The laser can be focused to change the spot size on the target, heated to change its frequency, and rotated to change its polarization relative to the target. A second laser can also be used either together or independently. A hole through the back of the calorimeter allows insertion of a fiber optical cable to measure the frequency of the laser. The laser is not being used at the present time.
Production of excess energy is once again claimed, but this time it is correlated with radiation being generated by the energy-producing process. This correlation is new and provides powerful evidence for the excess energy being real and being caused by a nuclear reaction.
As for the importance of radiation. I have gradually come to the conclusion that claims for excess energy can not be attributed to a nuclear process unless they are correlated with the products of a nuclear process. The correlation with helium production meets this requirement. However, these measurements are difficult and expensive. Detection of radiation also meets this reqirement. In this case, the measurement is easy and cheap. The only requirement is to actually use a sensitive detector within the apparatus. Radiation with the energy being detected can not be made by a chemical reaction. This is proof of a nuclear process. As for reproducibility, I have already reproduced the effect several times and intend to use the correlation to justify my claims for producing LENR.
The role of temperature was largely misinterpreted in the past. Production of power is controlled by the ambient temperature, not by using pulses, although pulses will have an effect because they change the average ambient temperature. This realization has profound importance to any proposed explanation.
The composition of the PdD is not the most important variable in determining whether excess power will be produced. This study shows that temperature is one of the most important variables, which according to my theory affects the rate at which the D can diffuse to the NAE where the nuclear reaction takes place.
Of course, the NAE must be first created before any excess power will be produced regardless of the temperature. Temperature alone does not create the NAE nor does the composition alone create the NAE.
The ultimate challenge is to discover exactly what does cause the NAE to form. That is the goal of this study.
PROGRESS-REPORT-5 (20Mb) (corrected)
See also:
08.31.15Progress Report #4
PROGRESS-REPORT-4 Effect of Important Variables
INTRODUCTION
The previous Progress Reports can be read at www.LENRexplained.com. The various novel features of the calorimeter are explored in this Progress Report.
These features included measurement of OCV, loading behavior, the effect of temperature on the various behaviors, and the behavior of volume expansion resulting from repeated loading and deloading.
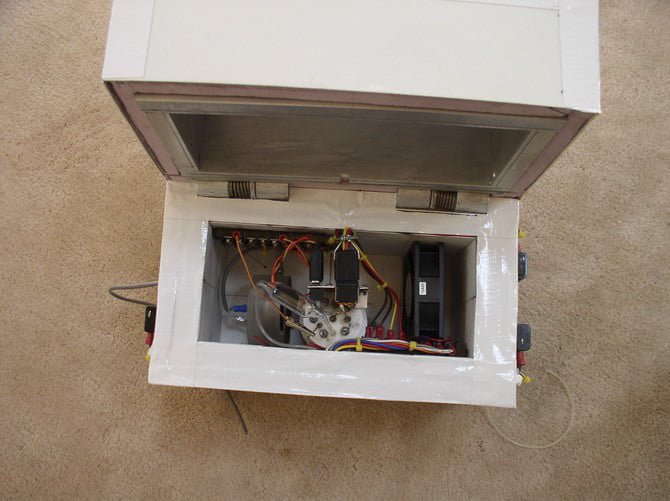
From Progress Report #1, a view inside the calorimeter showing the components. The cell is in the
center, the GM detector is on the left, and the fan is on the right.
A number of Pd-Ag compositions have been made and subjected to treatments and measurements considered important to this study. These treatments include measurement of the sample volume during various stages in its treatment and subjecting the sample to various methods to improve its reaction with hydrogen.
The relationship between each of these variables and production of excess energy will be established in order to improve the reproducibility of producing this extra energy. The initial results from the study of each of these variables are described and discussed below.
RESULTS
1. Expansion behavior
As described previously(1, 2), the guide used to design this research identifies expansion of the material as result of reaction with hydrogen as being an important variable for excess power production. Because the excess power requires deuterium to be present, the sample must first react with deuterium. This reaction causes the material to expand and change shape by more than would be expected based on the known increase in lattice parameter of the beta phase. This additional volume is retained when the hydrogen isotope is removed. This shape change is proposed to produce uneven stress and formation of cracks, which allow a nuclear process to take place in the gaps when the gap is exactly right. Consequently, the amount of hydrogen able to react and the resulting uneven expansion is important to know and control.
The expansion is measured using micrometers after various treatments have been applied. An example of this behavior using pure palladium is summarized in Table 1. ….
Continue to read PROGRESS-REPORT-4
1. E. K. Storms, The explanation of low energy nuclear reaction. (Infinite Energy Press, Concord, NH, 2014), pp. 365 pages, (updated e-version available at Amazon.com).
2. E. K. Storms, A Theory of LENR Based on Crack Formation. Infinite Energy 19, 24-27 (2013).
See also:
08.24.15Progress Report #3
This study involves creation of various alloys, their activation for reaction with deuterium in an electrolyte cell, and measurement of any energy resulting from LENR. The process involves variables important to success, which are described in this series of progress reports. Copies of Reports #1 and #2 can be accessed at www.LENRexplained.com, where subsequent reports will be found.
Progress report #1 describes the construction of the calorimeter being used in this study and the approach used to find nuclear active material. Progress report #2 describes the initial calibration and the expected errors. This report summarizes some problems and solutions discovered during the initial tests.
1. Calorimeter drift: The calibration of the calorimeter has been found to have changed, probably because the epoxy used to attach the TEC to the aluminum box has cured and now has a slightly different thermal conductivity. This change resulted in what appeared to be excess power being generated by the samples being studied. A routine test of the calorimeter using an inert platinum cathode revealed this change and the resulting error.
This test also revealed an error caused by the rapid variations in cell voltage caused by bubble formation that is not present when a resistor is used to apply energy to the calorimeter. This error was eliminated by inserting a 10,000 mfd capacitor in the voltage circuit to smooth the variations and by increasing the number of measurements that are averaged. These changes produce agreement between the power applied to the electrolytic cell and power applied to a resistor to within 0.02 watt over the range of applied power (0-34 watts) used in this study.
The resulting calibration values are plotted in Fig. 1, to which a quadratic equation is fit.

2. Preparation of samples: The samples are prepared by melting together Pd and Ag using a flame. The initial flame used LP gas and oxygen, which placed significant carbon in the material and caused many blisters to form on the surface after reaction with deuterium. These blisters interfere with making an accurate measurement of thickness.
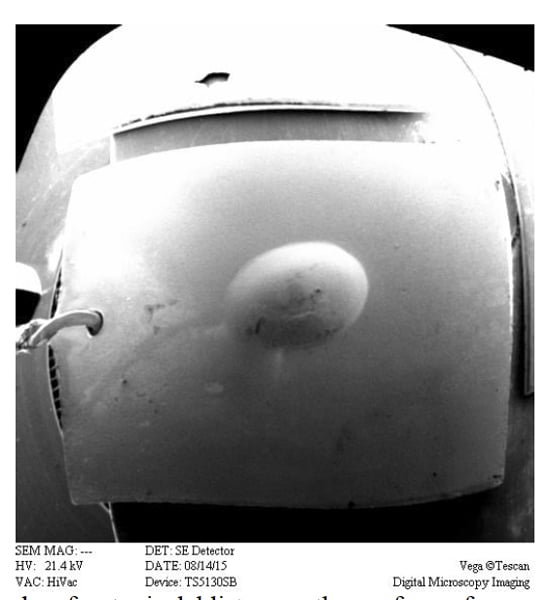
Fig. 2 shows a large blister on a typical sample. Many of the blisters were too small to detect by eye. In addition, the flame was not hot enough to fully melt the entire sample, leaving an unmelted region where the sample contacted the graphite sheet on which it rested. Consequently, a uniform composition of silver was difficult to achieve.
Read more in PROGRESS REPORT #3
See also:
08.13.15Progress Report #2
This report describes how a Seebeck calorimeter is calibrated in order to measure the amount of excess power produced by a cathode in an electrolytic cell contained in the calorimeter and the expected uncertainty in this value.
PROGRESS-REPORT-2 (3.5Mb)
A Seebeck calorimeter uses thermoelectric converters (TEC) to create a voltage proportional to the rate at which heat energy leaves the calorimeter. The present design consists of a water-cooled aluminum box with TEC covering the inside of each surface.
Consequently, the amount of heat energy leaving the box is measured regardless of where this loss takes place. A calibration using a known source of heat energy is required to calibrate the device.
Two different methods are used to apply known heat energy, with several variations involving the electrolytic cell or resistors external to the cell. Electric power can be supplied to the electrolytic cell containing a platinum cathode, which is presumed to produce no excess energy. Or electric power can be applied to a glass covered internal resistor located in the electrolyte, as can be seen in Fig. 1.
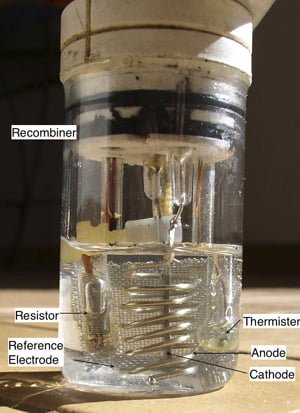 FIGURE 1. Pyrex electrolytic cell. The electrolytic cell consists of a cathode and anode and the internal resistor consists of a coil of nichrom wire immersed in oil contained in a thin wall Pyrex tube.
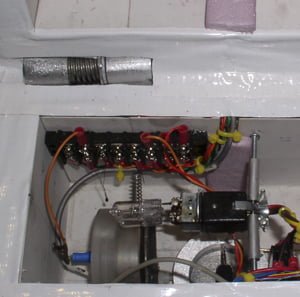 FIGURE 2. Picture of the two small quartz light bulbs used for calibration. One is connected to the circuit providing power to the anode and cathode and the other is connected to the circuit supplying power to the resistor contained in the Pyrex cell, which is removed for this test.
Read more in PROGRESS-REPORT-2 (3.5Mb)
See also:
08.3.15Progress Report #1: New calorimeter design will test nanocrack parameters
I’m starting a relatively rare kind of project for this field. I have designed and built a Seebeck type calorimeter for the purpose of testing my theory.
First, an attempt will be made to achieve reproducible heat production by applying my theory to the treatment of palladium-based samples. The treatment will be designed to create nano-sized cracks in which I propose the LENR process takes place. Once an active sample is obtained, it will be studied as the cathode in an electrolytic cell placed in a calorimeter.
A variety of behaviors will be explored including loading behavior, emission of photon radiation, effect of temperature on energy production, and the effect of laser light. The cathode can be rotated with respect to the GM detector and the laser to determine whether the angle of emitted or applied radiation relative to the surface is important.
View inside the calorimeter showing the components. The cell is in the center, the GM detector is on the left, and the fan is on the right.
Based on my theory, I predict that all occasions when LENR is observed, the same mechanism is operating. Therefore, information obtained using PdD would apply to all other materials and isotopes of hydrogen found to produce the same phenomenon.
The electrolytic method is chosen for this study because it is the most explored and best understood of the various methods known to initiate LENR. Nevertheless, the calorimeter would permit use of any other methods for initiating the effect, but on a small scale. The size of the sample is not important as long as accuracy of the measurement is sufficient large. The calorimeter used here is designed to have very high accuracy, which will be demonstrated in due course.
The following predictions will be explored:
1. The rate of the LENR reaction is regulated by the availability of hydrogen to the NAE, with a significant rate being possible at low hydrogen isotope compositions when the amount of NAE is sufficiently large.
2. The rate of the LENR reaction is affected by temperature only as result of how it effects the diffusion rate of hydrogen through the material.
3. Photon radiation will be emitted when LENR occurs, with a particular relationship between the angle between the surface and the detector.
4. The rate of the LENR reaction already underway can be increased by application of laser light, with an increased reaction rate as the energy of the light is increased. An enhanced effect can be expected when the frequency matches the dimension of an active crack.
5. Generation of excess energy does not require extended electrolysis when the NAE is created in advance.
This report describes the construction and physical layout of the calorimeter:

Top view of calorimeter assembly
The next report will describe the calibration and the general behavior of the tool, followed by studies of various behaviors of PdD.
See also:


| Posted in Science | 2 Comments »